

Notcoin (NOT) recently experienced a dramatic rally, surging over 300% in just two weeks before retracing. Despite this pullback, NOT still maintains an 82% gain over the past week, thanks to its rapid climb to a new all-time high of $0.02836. However, in the last 24 hours, the Notcoin price has trended downward, raising concerns […]
The post Notcoin ($NOT) Analysis: Bullish Pennant Pattern vs. Bearish Indicators appeared first on Coin Edition.
- Notcoin surges to new high of $0.02836, up 300% in two weeks, still holds 82% gain over the past week.
- Trading volume dips 21.17%, and open interest is down 4.60%, indicating market caution and lower liquidity.
- Bullish Pennant suggests potential uptrend continuation; key resistance at $0.0223, support at $0.0210.
Notcoin (NOT) recently experienced a dramatic rally, surging over 300% in just two weeks before retracing. Despite this pullback, NOT still maintains an 82% gain over the past week, thanks to its rapid climb to a new all-time high of $0.02836.
However, in the last 24 hours, the Notcoin price has trended downward, raising concerns among investors about whether to sell or hold. The recent declines in trading volume and open interest have fueled questions about the market’s future direction. As of press time, NOT was up 1.22%, trading at $0.0221, while its market capitalization increased by 1.16% to $2,271,366,971.
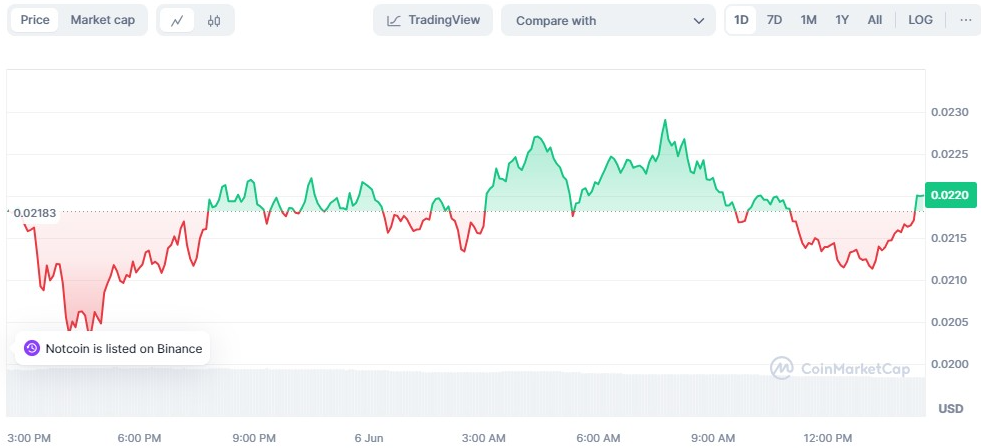
NOT/USD 1-day price chart (source:CoinMarketCap)
Despite the market cap surge, there has been a reduction in trading volume for Notcoin, with a decrease of 21.17% to $3.71 billion. This sharp decline indicates a drop in trading acti…
The post Notcoin ($NOT) Analysis: Bullish Pennant Pattern vs. Bearish Indicators appeared first on Coin Edition.
